

Our approach
Grids have always been configured by developers reading docs. SuperPlot is built for the next consumer: coding agents that generate, inspect, and refine data views in conversation with humans. That changes what the API has to be: composable, typed, and declarative from storage to pixels.
Headless architecture
How a layered, pattern-consistent grid core makes AI agents effective collaborators, not just consumers of an API.
The pipeline
The grid is structured as a strict four-stage pipeline. Each stage has a single responsibility, a well-defined contract with the next, and no knowledge of the layers above or below it beyond that contract.
DataSource  ->  DataModel  ->  DataViewModel  ->  Renderer
(storage) (transform) (bridge) (pixels)- DataSource: raw data storage and query execution. Loads data from URLs, runs SQL against an in-browser SQL-compliant DB instance, or connects to an API backend with a payload defining the transformations. No knowledge of what the data means.
- DataModel: transforms data for a specific use case. Handles pivot aggregation, flat table grouping, sorting, filtering, and pagination. Produces a ready-to-render structure.
- DataViewModel: render-ready data plus rendering-dependent metadata. Can hold the full dataset if it fits in memory, or is aware of paged rendering when more-than-memory data is present. Carries facet hierarchies, column metadata, and cell-level annotations. The renderer slices into it for the visible viewport.
- Renderer: turns the view model into DOM. Manages the CSS grid layout, fixture placement, cell recycling, and scroll handling. Consumes the view model without interpreting it.
Each boundary is a typed interface. DataSource<T> knows nothing about pivots. DataModel knows nothing about rendering. DataViewModel is a thin, ready-to-render structure that the renderer consumes without transforming. This separation is not incidental. It is the primary mechanism that makes the grid agent-friendly.
Why agents thrive on this
1. Agents can operate on a single layer without understanding the rest
An agent asked to “add a sort dropdown” only needs to understand the DataModel contract: pass a sort config into the data model. It never touches SQL generation, viewport slicing, or DOM layout. The blast radius of any change is bounded by the layer it lives in.
2. Open-closed architecture at every layer
Each layer exposes extension points without requiring modification of the core. The renderer accepts custom renderers for facets and value cells and multiple extension points (fixtures), while it manages everything else: virtualization, updates, smooth scrolling, events, and layout. The DataModel accepts a table-algebra-driven config to drive transformations and a separate layer for metadata management, while it manages pagination, reshaping, and query generation internally.
This is critical for agents. An agent does not need to fork the grid or understand its internals. It works within the extension points. The guardrails are tight enough that structurally valid code is almost certainly functionally correct, which is exactly the kind of constraint agents work well around.
3. Patterns repeat across the entire surface area
The same structural patterns show up everywhere in the grid. Every layer follows the same open-closed contract: a core that manages complexity internally and a small set of typed extension points for customization. Fixtures, renderers, metadata plumbing, and data model configs all follow this shape. The resolver/reshaper pattern appears in both global and page-scoped metadata. Cell renderers share a single signature regardless of content.
This consistency compounds for agents. Once an agent has learned one contract boundary (one fixture, one metadata resolver, one renderer), it can produce any variation. The few-shot surface is small because the combinatorial surface is generated from a handful of repeating patterns. An agent does not need to learn the grid; it needs to learn the pattern, and then the grid is just instances of it.
4. A metadata layer built into the core
Grids are fundamentally for data display. But a complex grid needs more than raw values. It needs to render data in the context of computed metadata: column-level statistics, per-cell quality flags, distribution summaries, aggregated indicators. Without a first-class metadata layer, this logic ends up scattered across ad-hoc state, manual SQL queries, and brittle plumbing between the data fetch and the renderer.
Our grid builds this metadata layer into the core. It touches both the data model (where metadata is computed alongside the data fetch) and the renderer (where metadata is available to every cell, fixture, and header). This is what allows an agent to build features like “highlight cells above column average” or “show per-column null distributions” without stitching together disconnected pieces. The metadata flows through the same pipeline as the data itself, opening up complex, interactive grids on top of the existing architecture with no core modifications.
Concrete example: the data wrangler
The Standard Table demo on this site was built entirely through a conversation with an AI agent. At no point did the agent modify the grid core. Every feature (the quality bars, histograms, drag-to-filter overlays, the minimap, the dimension filter popover) was built by composing the existing extension points:
- 5 custom fixtures (RowNumberFixture, QualityBarFixture, HistogramFixture, QualityDotFixture, MinimapFixture, SummaryFixture), all subclasses of
PVerticalFixtureorPHorizontalFixture - 1 metadata plumber with global and page-wise resolvers computing missing counts, distributions, minimap buckets, and per-cell null flags via SQL
- 1 custom cell renderer handling null highlighting, alignment, formatting, and unit prefixes
- 1 facet track renderer adding filter icons to column headers
- Interactive filtering via
ScalarFilterpredicates passed to the IR: histogram range selection and dimension bar toggling, both combining through the same filter pipeline
The grid core received zero modifications. Every feature was an extension, not a patch.
Fullstack grid
Why the hard part of a grid was never the rendering, and how collapsing the frontend/backend boundary changes the equation.
The blurring line
Agent-driven programming is dissolving the traditional split between frontend and backend engineering. An agent writing a pivot table does not think in terms of “I’ll build the UI, someone else will build the API.” It thinks end-to-end: what data do I need, how should it be transformed, and how should it be rendered. The separation of concerns that made sense for human team coordination becomes friction when a single agent is responsible for the full path from data to pixels.
This shift matters for grids more than most UI components, because grids are not self-contained. A grid is a view of data, but the transformations required to produce that view have historically lived on the backend, maintained by a separate team, often in a separate language.
The transformation problem
Consider what a pivot table actually requires from the data layer. The user configures rows, columns, measures, filters, sorts, expand/collapse state, and pagination. Every combination of these produces a different query. A single pivot config change, such as adding a nested row field, changes the GROUP BY, the SELECT projections, the ORDER BY, and potentially the pagination strategy.
For a standard flat table the surface is different but equally complex: grouped rows with expand/collapse, multi-field sorting, set filters and range filters, column-level aggregations, and data shape changes as the user interacts. Each of these states needs to produce the correct transformation query, whether that’s SQL, an in-memory operation, or an API call to a backend that speaks a different dialect.
Traditionally, this is a significant backend effort. A backend developer writes and maintains query generation logic that maps every possible UI state to correct, performant queries across the target database. This is a combinatorial problem that grows with every new feature, every new filter type, every new aggregation. It is also entirely invisible to the frontend. The grid just receives JSON and renders it.
The DataModel as a contract
Our grid’s DataModel layer exists specifically to own this problem. It takes a declarative config expressed in table algebra (cross, hierarchy, concat for pivots; groupBy, sort, filter for flat tables) and generates the correct transformation query internally. The frontend does not write SQL. The backend does not need to know the grid’s UI state.
UI State (pivot config, filters, sort, expand/collapse)
        |
        v
  Table Algebra Config
        |
        v
  DataModel (query generation)
        |
        v
  DataSource (execution against target DB / API)
The DataModel generates queries for different targets. For in-browser use, it produces SQL that runs against DuckDB-WASM. For server-side deployments, the same table algebra config can generate queries for different ORMs and databases: PostgreSQL, MySQL, BigQuery, or any SQL-compliant backend. The transformation logic is written once in the DataModel; the DataSource handles execution against the specific target.
This is not an abstraction for abstraction’s sake. It directly addresses the combinatorial explosion: every possible state of pivot config, grouping, sorting, filtering, and pagination is handled by the DataModel’s query generator, not by hand-written backend endpoints. Adding a new filter type or aggregation to the grid does not require a corresponding backend change. The DataModel already knows how to express it.
Reducing integration time
The practical impact is that the path from “I have data in a database” to “I have an interactive, feature-rich grid displaying it” collapses from a multi-sprint, multi-team effort to hours of work. An agent (or a developer) points the DataSource at a database, defines a schema, and writes a table algebra config. The DataModel handles query generation, the ViewModel prepares render-ready data, and the Renderer draws it. No backend API to design, no query builder to maintain, no translation layer between UI state and database queries.
Table algebra
A formal operator model for pivot table axis construction, and why it eliminates the combinatorial query generation problem.
Beyond simple pivots
Our grid handles standard flat tables with full sorting, filtering, grouping, and pagination. But where the architecture distinguishes itself is in pivot table configuration. Real-world pivot tables are not just “rows and columns with a measure”. They require nested hierarchies, side-by-side measure comparisons, cross-products of dimensions, and arbitrary combinations of all three. Most grid libraries either restrict what configurations are possible, or push the query generation problem to the backend developer.
We take a different approach. The pivot table’s row and column axes are defined using a small set of composable operators drawn from the table algebra formalized in the Polaris paper.
The operators
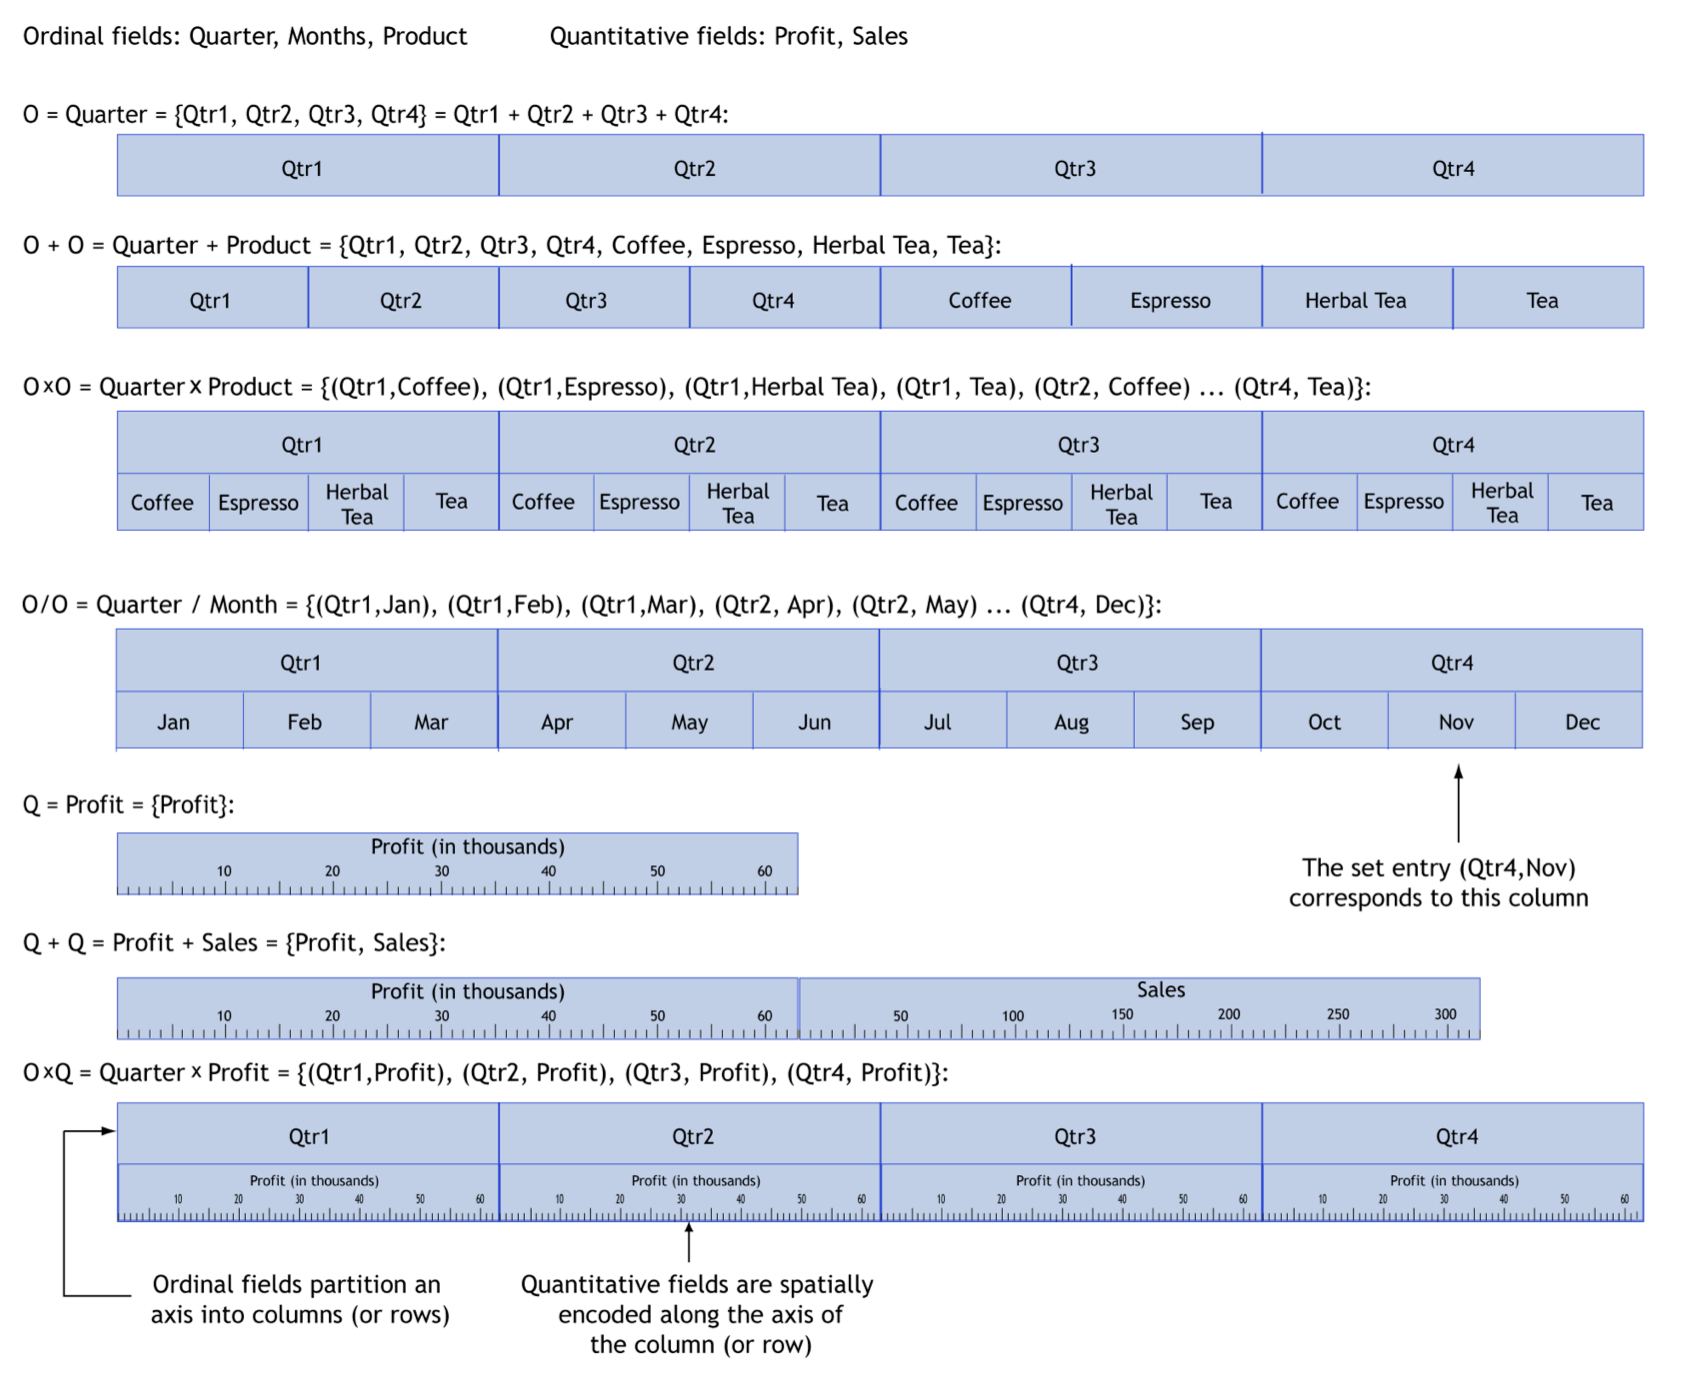
Three operators compose to define any axis of a pivot table:
- Cross (
cross) produces a cartesian product of two fields. Each value of the first field is paired with every value of the second. This is what creates nested headers, for example, each Quarter containing every Product underneath it. - Nest / Hierarchy (
hierarchy) produces a hierarchical nesting where the second field’s values are scoped to the first. Unlike cross, only the combinations that exist in the data appear. Quarter / Month produces Jan–Mar under Q1, Apr–Jun under Q2, and so on, with no impossible combinations. - Concatenation (
concat) places fields side by side along the same axis level. Profit + Sales puts both measures next to each other as peer columns, not nested. Cross with a dimension produces per-dimension measure columns: each Quarter gets its own Profit and Sales.
These operators are fully composable. An axis definition like cross("Agency", concat("Salary", "Hours")) produces a column axis where each agency has Salary and Hours side by side. Nesting this further with hierarchy or adding more concat levels creates arbitrarily complex configurations, all expressed declaratively.
The query generation problem
This is where the real complexity lives. Each combination of these operators on rows and columns, combined with sort, filter, pagination, and expand/collapse state, produces a different transformation query. A cross on columns with a hierarchy on rows with two concatenated measures and a range filter requires a specific GROUP BY, specific SELECT projections, specific ORDER BY, and specific pagination logic. Change any part of the config and the query changes.
Traditionally, backend developers write this query generation by hand. In practice, this means most implementations restrict the configurations they support (no nested cross-products, no mixed hierarchy/concat, no more than two levels) because the combinatorial surface of correct queries is too large to maintain manually. Bugs in this layer are subtle: wrong GROUP BY clauses produce silently incorrect aggregations, not errors.
Our DataModel owns this entirely. The table algebra config is the input; the correct transformation query is the output. Every valid combination of cross, hierarchy, and concat on any number of levels, with any sort/filter/pagination state, produces a correct query. The developer (or agent) never writes SQL for pivot transformations. They compose operators.
Dimensional projection
We extended the original Polaris model with our own dimensional projection semantics. This enables a pattern common in Excel but historically difficult to implement in database-backed grids: showing an aggregated summary row alongside its dimensional breakdown, with expand/collapse to toggle between the two.
In a traditional pivot, collapsing a dimension level means removing it from the query entirely, so you lose the breakdown. With dimensional projection, the collapsed state shows an aggregate computed at the database layer (not a client-side rollup), and expanding reveals the full breakdown underneath. The projection state is part of the table algebra config, so the DataModel generates the correct query for any combination of expanded and collapsed levels across both axes.
This is significant because it moves Excel-style aggregate navigation into the database layer. The aggregates are correct by construction: they are computed by the same query engine that produces the detail rows, not by a separate client-side summation that can drift from the source data.