
Pivot with Table Algebra
A pivot explodes into countless configurations. SuperPlot expresses any axis with three composable operators, cross, hierarchy, and concat, and generates the correct query for every one.
What is a pivot table
A pivot table summarizes a flat dataset by arranging one set of fields down the rows and another across the columns, then aggregating a measure at each intersection. Sales by region and quarter, or headcount by department and level: the shape is familiar, but the machinery behind it is not.
Building one end to end is deceptively large. A pivot is not a single layout but a space of them. Rows and columns can each carry several dimensions, nested or placed side by side, together with one or more measures, and every arrangement is a different query. Layer sorting, filtering, pagination, and expand and collapse on top, and the number of distinct states grows combinatorially. Each state has to produce a correct GROUP BY, the right projections, and the right ordering, or the aggregates come out silently wrong.
This is why a pivot needs a semantics rather than a pile of options. To cover every case you need a small, composable language that describes any axis and maps cleanly to a query. That language is table algebra, which we cover in depth in our approach.
Our approach
SuperPlot treats the pivot as a first-class citizen. It helps you implement not just the grid but the data generation too, because producing correct data for different pivot configs is itself a combinatorial problem. The DataModel defines the input and output contract. We ship a default implementation that generates SQL for the browser via DuckDB WASM, plus a skill that generates the same for your own toolchains and infrastructure. The DataViewModel then receives the reshaped result as a render-ready structure, and the renderer draws it. From raw rows to pixels, the whole path is covered.
Pivot Table: table algebra by exampleEdit cross, hierarchy, and concat expressions on live pivots and see the config each one produces.Table algebra
Each axis, rows and columns alike, is defined with three composable operators, drawn from the table algebra formalized in the Polaris paper.
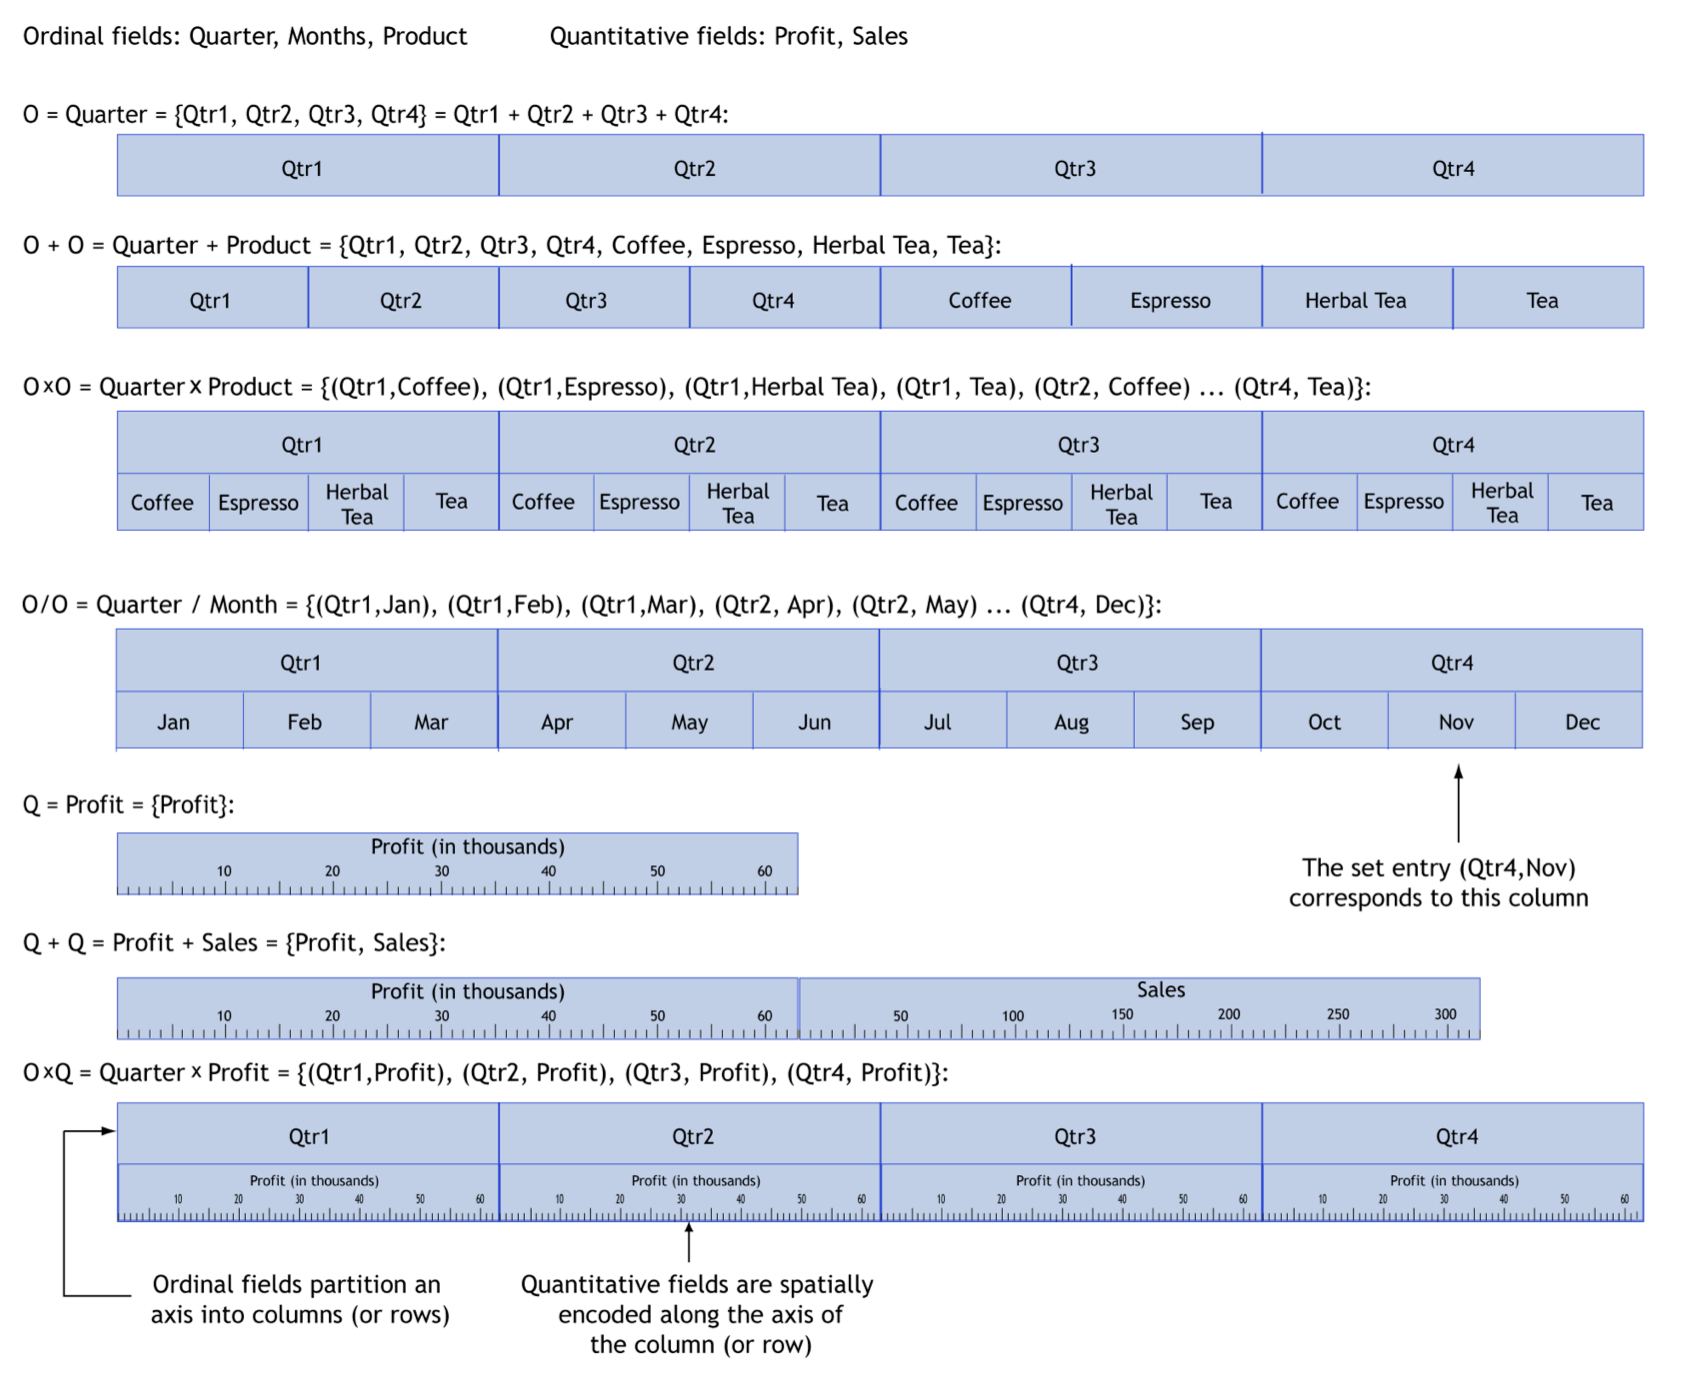
Figure from Polaris: A System for Query, Analysis, and Visualization of Multidimensional Databases.
- cross produces a cartesian product of two fields, pairing every value of one with every value of the other. This is what creates nested headers, for example each Quarter containing every Product beneath it.
- hierarchy nests the second field under the first and keeps only the combinations that exist in the data. Quarter over Month yields Jan to Mar under Q1, and so on, with no impossible cells.
- concat places fields side by side at the same level. Profit and Sales become peer columns rather than nested ones.
These operators compose, so an axis reads like a small expression:
// each plan gets MRR and Seats side by side
cross("plan", concat("mrr", "seats"))

// region contains its countries, which contain their industries
hierarchy("region", "country", "industry")

// each quarter carries its own units and revenue columns
cross(hierarchy("year", "quarter"), concat("units", "revenue"))
Nesting hierarchy inside cross, or adding more concat levels, produces arbitrarily complex layouts, all declarative. Without a grammar like this there is no practical way to build a general pivot table. Every configuration would be a bespoke, hand-written query, and the combinatorial surface is far too large to maintain by hand.
Crucially, the same config also carries sorting, filtering, pagination, and dimensional projection, the expand and collapse of a dimension into a database-computed aggregate. Any of these operations composes with the axis expressions, and the DataModel still emits one correct query for the combined state. Arbitrary operations layer on the same way.
Live pivot analytics demoPlay with the power of table algebra in a live pivot with sample data.Fullstack Grid
Preparing a grid's data is as hard as rendering it. SuperPlot facilitates agentic development across the full path from query to pixels, generating server code for your frameworks and ORMs.
Metadata
How to attach and consume metadata, the data about your data, alongside the grid's main data pipeline. Metadata flows through a resolver/reshaper pattern in the DataModel, gets stored on the ViewModel, and arrives at cell renderers for custom visualization.